Project | 01
San Francisco International Airport (SFO) - Terminal Gate Map
SFO previously had no spatial base layer for the airport terminals on record. Thus, I collaborated with engineers and designers to use their work on Autodesk, and transformed and converted CAD drawings. I then overlayed and highlighted terminals and brought it into our GIS system.
Tool: ArcGIS Desktop, Online and Server, AutoCAD
Project | 02
Precipitation and Evaporation Changes in California in the Month of December.pdf
The California drought has been going on for years. However, 2015-2016 has been known as an El Niño year and, according to scientists, 2015 was the hottest year in historical record. El Niño is a climate pattern that describes the unusual warming of surface waters in the eastern tropical Pacific Ocean, and the El Niño years can involve excessive rainfall compared to normal years in California. During the peak of winter this past December, California experienced more rain than had been seen for decades. I am comparing precipitation and evaporation during the month of December between 2014 and 2015. The following is my calculation: Percent change = (New value – Old value) / Old value * 100. From December 2014 to December 2015, the results show that precipitation had increased dramatically in Central and Northern California. However, evaporation had recorded in negative values, which meant that Northern and Central California were very wet because of more rainfall and less evaporation. In contrast, Southern California had tremendously increased in evaporation but was drier with very little precipitation.
Tool: ArcGIS Desktop, Adobe Illustrator
Project | 03
SFO - Elevators, Escalators and People Movers
SFO had no visuals on their elevators, escalators and people movers. The solution was I built a database to keep the details and the locations of the infrastructure for the maintenance team to maintain existing infrastructure. I also used added floor plans on ArcGIS app to track the infrastructure for QA/QC.
Tool: ArcGIS Desktop, Online, Server, ModelBuilder and WepApp Builder
Project | 04
SFO - Cell Phone Tower Locations
Mobile network providers have unstable coverage near the SFO. Therefore, I built an SFO cell phone tower coverage using buffer ring analysis to show a 10-mile (increment of 1-mile) distance of each of the mobile providers' coverage towers to show network coverage. I looked for overlap coverages between Sprint, Verizon and AT&T cell phone tower locations around SFO as provided to SFO IIM. The distance calculation was not meant to model a cell phone tower signal propagation.
Tool: ArcGIS Desktop
Project | 05
SFO - Terminal Furniture
Over 60k Airport furniture had been stolen every year. The solution was to build a spatial database to track all new furniture that included the conditions and costs of each furniture for the maintenance team to repair and renew them. I utilized ArcGIS app to track and label furniture attributes on iPad so I could do cost analysis on new and existing furniture to forecast new inventory cost.
Tool: ArcGIS Desktop, Online, Server, ModelBuilder and Survey123, Prezi
Project | 06
SFO - Basemap
SFO previously had no basemap for the airport and surrounding areas. I've developed a basemap that was used for every department including engineering, design, architecture, finance, business operations, planning, construction and more. They could easily identify their location within the airport and looked for the right department since there were department building numbers in the basemap.
Tool: ArcGIS Desktop
Project | 07
SFO - Basemap Retro
Similiarly, I developed another version of a basemap in retro colors to pinpoint every department building structure with building number for employees to locate the right building.
Tool: ArcGIS Desktop
Project | 08
SFO - Aerial Imagery Basemap
SFO had imagery taken by 3rd party vendor. The C-suite wanted to have an aerial imagery basemap for each of the executive and committee members. Therefore, after I received the aerial imagery, I georeferenced and loaded into our GIS system so that SFO executives could have this as a spatial file and pdf. More importantly, after it was in the GIS system, I brought it to print it out as a placard for every senior executives to enjoy our work view.
Tool ArcGIS Desktop
Project | 09
A California Earthquake Hazard Map
California has always been proned to earthquake. Our team would like to do geospatial analysis to locate which cities have a higher probability of earthquake using kernel density analysis and Gutenberg-Richter Magnitude Frequency Analysis to categorize the magnitude of earthquake from 2,4,6,8, and 10.
Tool: ArcGIS Desktop, Excel, PowerPoint
Project | 10
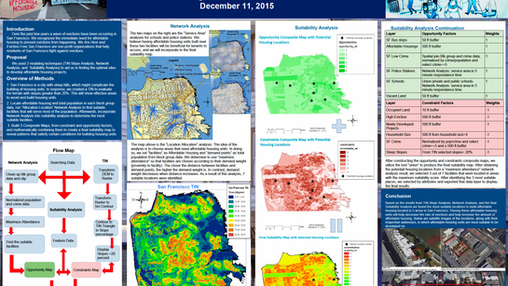
Eviction Free San Francisco
Eviction is a concurrent theme in San Francisco. Our team wanted to investigate in the geospatial analyses aspect on locating where the opportunities lied and troubled areas using flowcharts, network analysis, suitability analysis and TIN analysis.
Tool: ArcGIS Desktop, PowerPoint
Project | 11
Sausalito
This was a personal project that I wanted to paint a picture of one of my favorite town in the SF Bay Area.
Tool: Adobe Illustrator
Project | 12
Vector Suitability Analysis - Build New High Schools in Berkeley, CA
This was a personal project that I was looking for locations to build new high schools around Berkeley, CA using social economic data from the government to create vector suitability analysis to locate optimal locations.
Tool: ArcGIS
Project | 13
Raster Suitability Analysis - Build New Elementary School in Claremont Canyon, CA
This was a personal project that I was looking for locations to build new elementary schools around Clarement Canyon, CA using imagery data such as USGS to create raster suitability analysis to locate optimal locations.
Tool: ArcGIS
To see more or discuss possible work let's talk >>
Follow me
© 2024 by James Kong
Call
C: 604-313-6221
Contact


